Choose a business area
Start from an approved dataset so users work with governed business definitions.

OrangeTree Analytics gives authorized users a guided path from business area and fields to filters, visualizations, saved analyses and responsive dashboards.
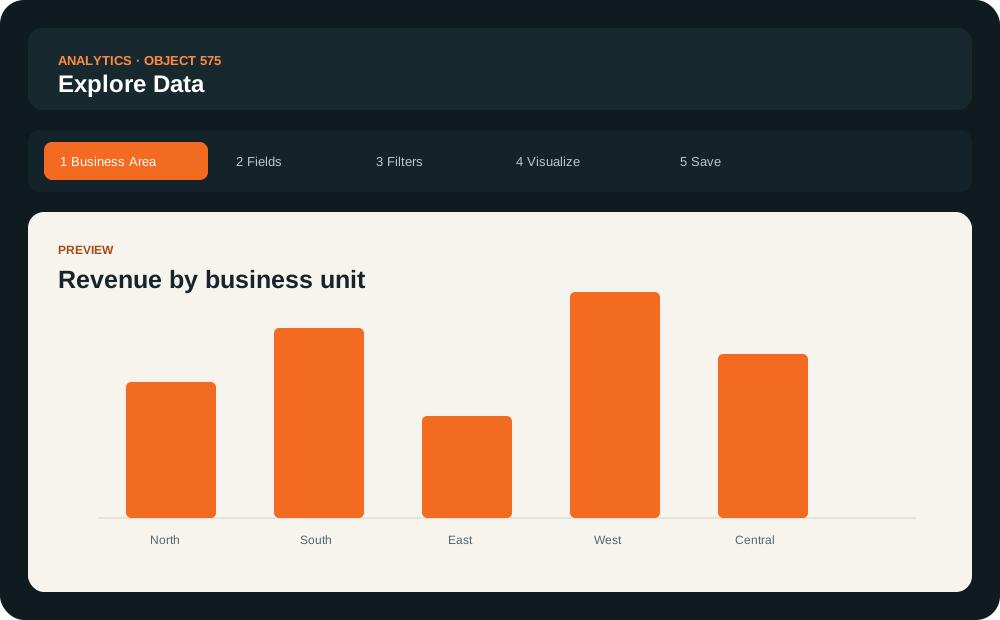
Start from an approved dataset so users work with governed business definitions.
Choose dimensions and measures from business-friendly field names.
Add one or more conditions to focus the result set.
Preview tables, KPIs, and interactive chart types before saving.
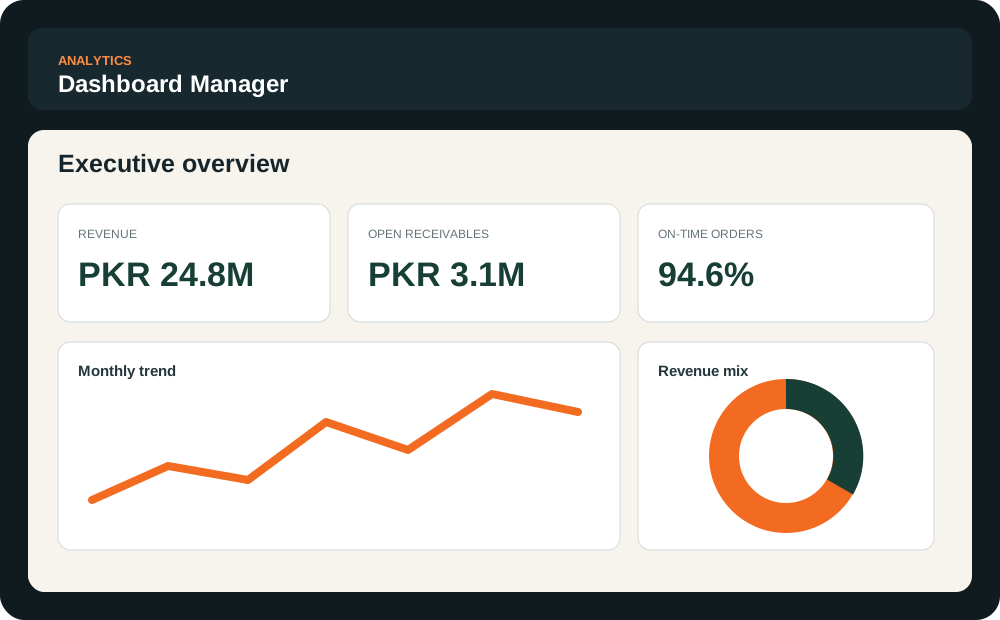
Create or update dashboards, search approved components, add tiles, drag them into order, select tile sizes and visualizations, and configure refresh intervals.
We’ll demonstrate Explore Data, reports, visualizations and dashboard assembly with a workflow relevant to your team.